

litellm-spend). Reads LiteLLM’s spend
data directly from CNPG Postgres via a least-privilege read-only role: no LiteLLM Enterprise, no
Prometheus, no Langfuse.
Model
- DB role
grafana_ro: CNPG managed role,pg_read_all_data(SELECT-only). Defined inplatform/litellm/db/cluster.yaml; password GSMlitellm-grafana-ro-password→ ESO secretlitellm-grafana-ro(ns litellm). - Datasource: ESO-rendered Secret
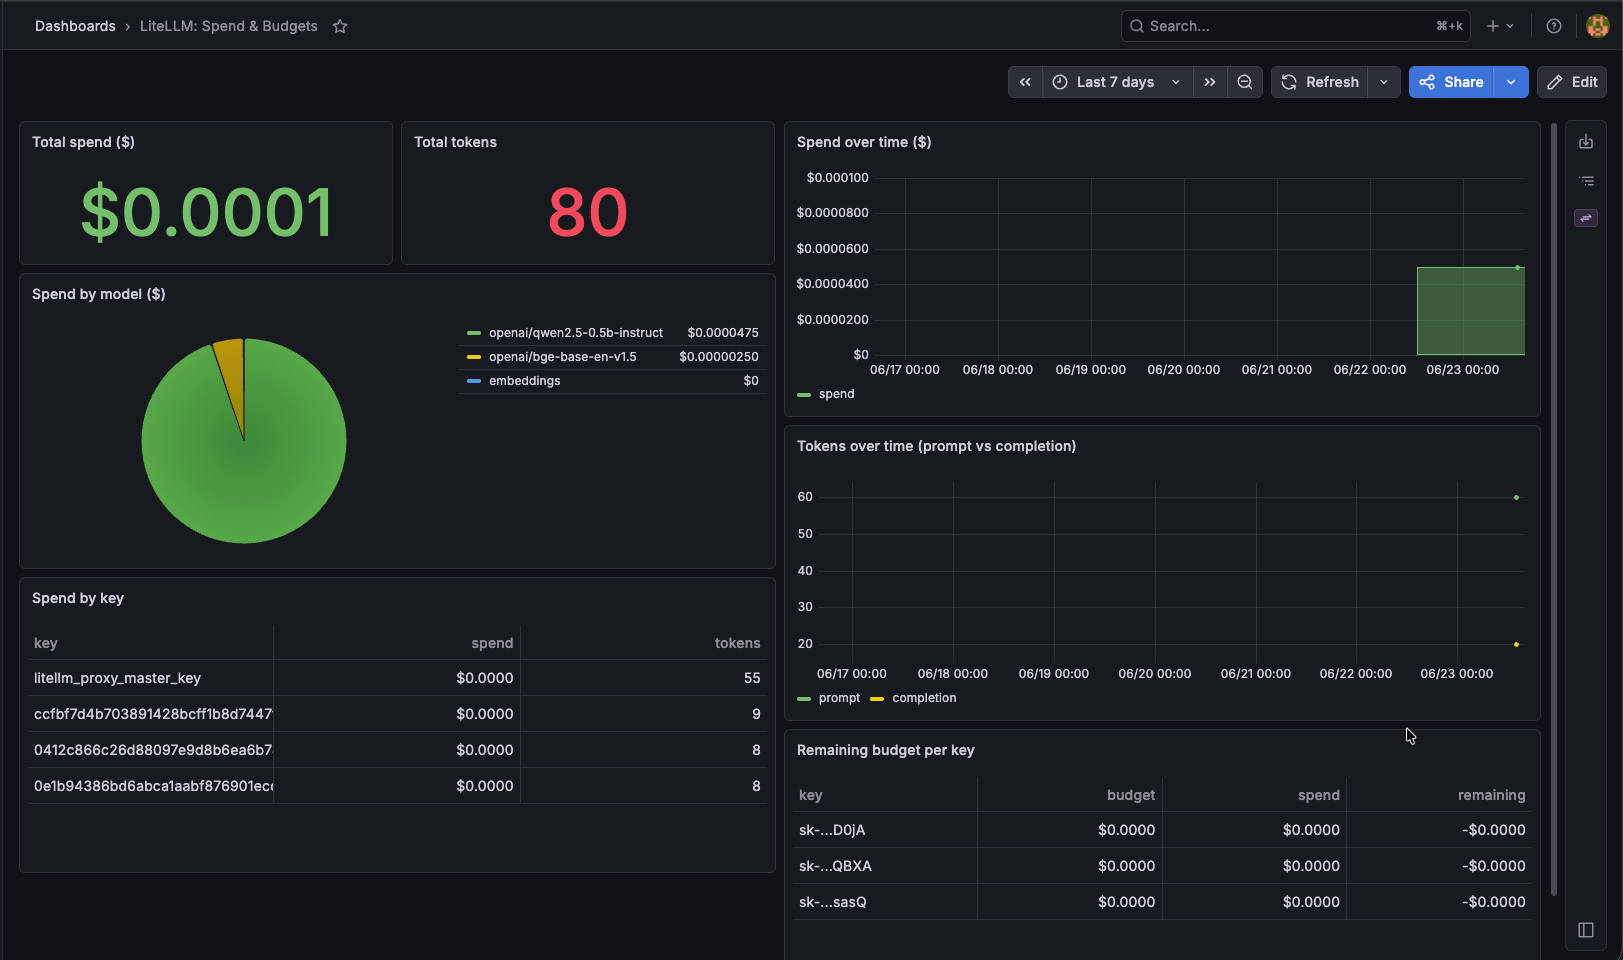
grafana-datasource-litellm(ns monitoring) labelledgrafana_datasource: "1"; the Grafana datasource sidecar auto-imports it (platform/observability/values.yaml). - Dashboard:
dashboards/litellm/litellm-spend-dashboard.json(uidlitellm-spend), loaded by thegrafana-litellmapp in thellm-gatewayprofile.
1. Prereq: the secret (do this first)
litellm-bootstrap (creates the role + ESO) and grafana-litellm (datasource +
dashboard). CNPG reconciles the grafana_ro role from the secret automatically.
2. View it
litellm.md §3) so there are spend rows to show.
3. Troubleshooting
Datasource missing in Grafana. The datasource sidecar must be enabled (grafana.sidecar.datasources.enabled: true, searchNamespace: ALL) and the Secret must carry the
grafana_datasource: "1" label. Check it rendered:
- Confirm the role exists:
kubectl -n litellm exec -it litellm-pg-1 -- psql -U postgres -c '\du grafana_ro'. - Confirm the ESO secret resolved:
kubectl -n litellm get secret litellm-grafana-roandkubectl -n litellm get externalsecret litellm-grafana-ro. - The datasource targets
litellm-pg-rw(the writable primary). With a single instance the-roservice has no endpoints: do not point the datasource at it until HA adds replicas.
"LiteLLM_SpendLogs" / "LiteLLM_VerificationToken"
and "startTime"; re-check column names with \d "LiteLLM_SpendLogs" if a LiteLLM bump breaks a panel.