

serving/raw-vllm: a concurrency sweep measuring latency
(TTFT / ITL / end-to-end) and throughput, with GPU and KV-cache utilisation read from the
same Prometheus the dashboards use. Harness: vllm bench serve (the repo’s benchmarks/ Job).
Run context
| Commit | 8e78aaa |
| GPU | 1× NVIDIA L4 (23 GB), g2-standard-4, on-demand |
| Driver / CUDA | 580.126.20 / 13.0 (GKE-managed, COS) |
| Model | Qwen/Qwen2.5-0.5B-Instruct (BF16) |
| vLLM | v0.23.0 (V1 engine) |
| Server args | --gpu-memory-utilization 0.6 --max-model-len 8192 |
| Kubernetes | GKE v1.36.0-gke.2684000 |
| Request shape | 256-token input / 128-token output, --ignore-eos, seed 42 |
| Load pattern | closed-loop (--request-rate inf) at fixed max-concurrency |
Results: concurrency sweep
Latencies in milliseconds. TTFT = time to first token (prefill), ITL = inter-token latency (decode), E2E = end-to-end request latency.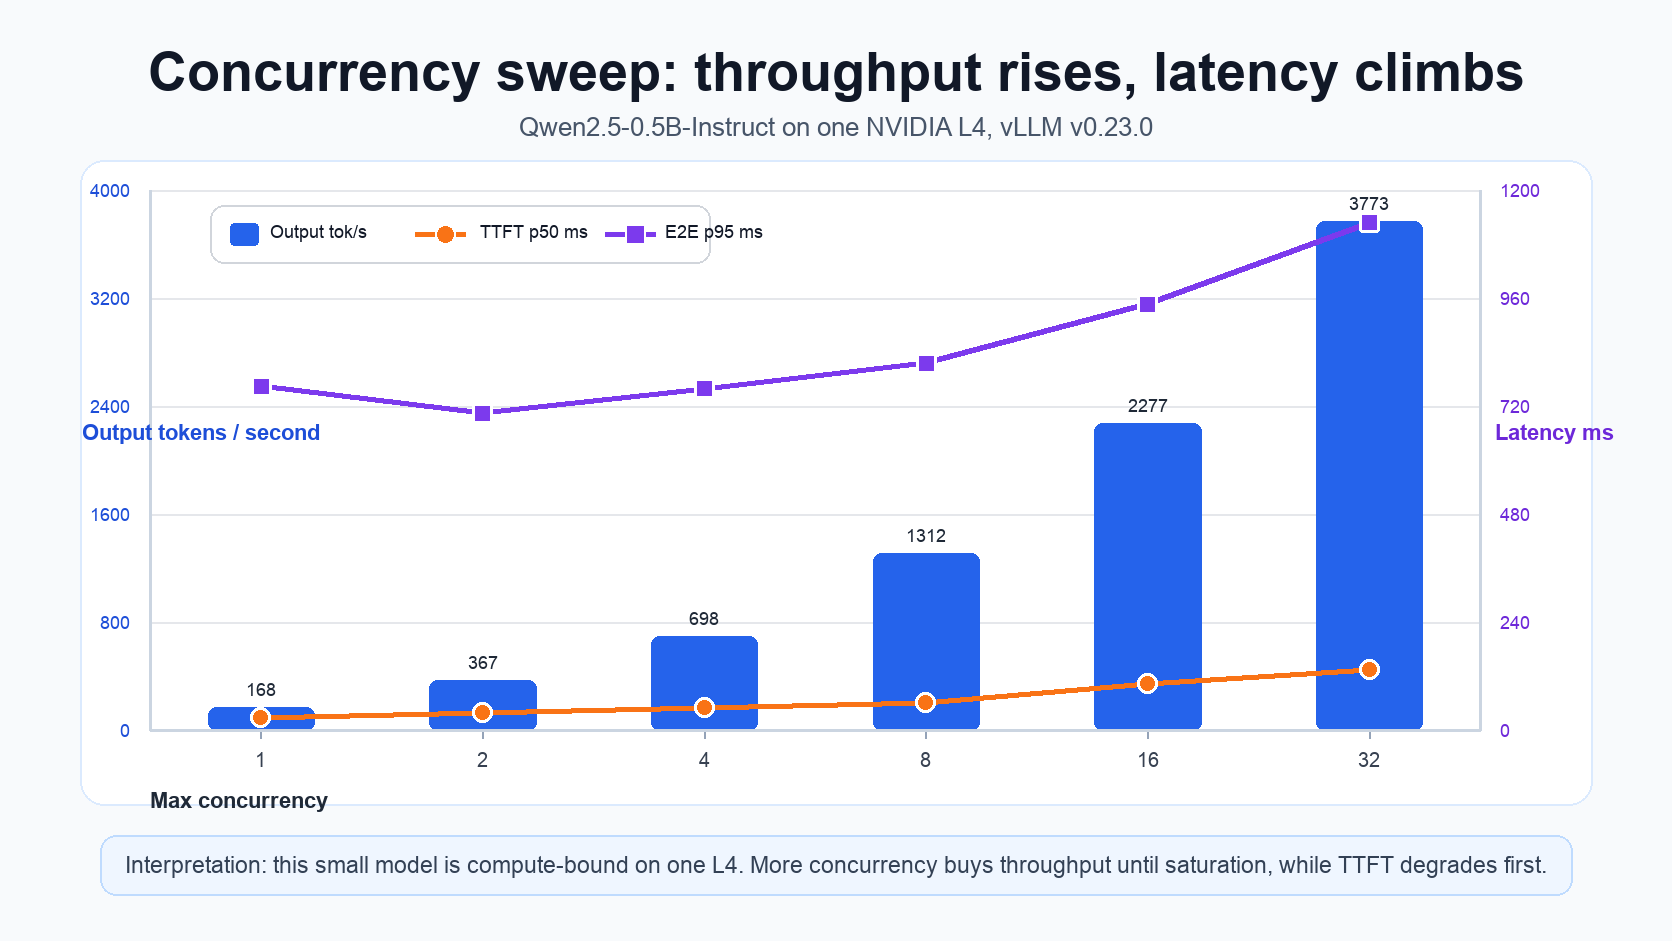
| concurrency | req/s | out tok/s | TTFT p50 | TTFT p95 | ITL p50 | ITL p95 | E2E p50 | E2E p95 |
|---|---|---|---|---|---|---|---|---|
| 1 | 1.3 | 168 | 27.0 | 115.5 | 5.1 | 6.1 | 679 | 765 |
| 2 | 2.9 | 367 | 37.8 | 48.2 | 5.2 | 6.3 | 698 | 705 |
| 4 | 5.4 | 698 | 50.1 | 85.4 | 5.3 | 6.4 | 722 | 760 |
| 8 | 10.2 | 1312 | 60.9 | 88.4 | 5.5 | 7.4 | 772 | 816 |
| 16 | 17.8 | 2277 | 103.8 | 135.7 | 6.0 | 8.9 | 880 | 947 |
| 32 | 29.5 | 3773 | 135.3 | 191.8 | 7.1 | 12.0 | 1082 | 1128 |
| peak | |
|---|---|
GPU utilisation (DCGM_FI_DEV_GPU_UTIL) | 100 % |
GPU memory used (DCGM_FI_DEV_FB_USED) | ~13.9 GiB (the 0.6 reservation, not workload pressure) |
KV-cache usage (vllm:kv_cache_usage_perc) | 1.1 % |
Requests running / waiting (vllm:num_requests_*) | 31 / 0 |
What the numbers say
- Compute-bound, not memory-bound. GPU compute pins at 100 % under load while KV-cache
never exceeds ~1 % and nothing ever queues (
waiting = 0). For a 0.5B model the KV footprint per request is tiny, so on one L4 you run out of compute long before memory. Scaling pods/replicas wouldn’t help on a single GPU: the GPU is already the bottleneck. - TTFT degrades first. As concurrency rises 1 → 32, TTFT p50 grows ~5× (27 → 135 ms): more requests competing for prefill slots queue at the front of the request. This is the first SLI to watch under load.
- Decode (ITL) stays cheap and flat. ITL holds ~5-6 ms until concurrency 16, reaching 12 ms p95 only at 32. Continuous batching keeps per-token decode efficient; the small model means decode is never the constraint here.
- Throughput scales near-linearly to saturation. Output throughput rises 168 → 3773 tok/s (≈22×) from concurrency 1 → 32, tracking GPU utilisation toward 100 %. Past saturation, more concurrency buys throughput only by trading latency (TTFT/E2E climb).
- E2E is decode-dominated. End-to-end is ≈ TTFT + 127×ITL; with 128 output tokens the ~5-7 ms ITL accounts for most of the ~0.7-1.1 s total, so E2E tracks ITL more than TTFT.
Live view
The vLLM Serving Grafana dashboard (dashboards/vllm-serving-dashboard.json) shows the
same signals in real time: TTFT/ITL/E2E percentiles, prompt vs generation throughput,
running vs waiting requests, KV-cache usage, and GPU util/mem (DCGM).